Update (11/12/15): See this post to integrate the following code with leaflet.
After finding no real way to use background maps with SigmaJs, I stumbled on this example of combining leaflet with D3.js: http://bost.ocks.org/mike/leaflet/. The example is more closely aligned with what I want to achieve, which is using a display library to show a social network that respects / interacts with underlying geography. This would be a very valuable visualization for both TBib/BAM and my own work on garrisons, and completing it will allow me to get back to other tasks, like pounding out Greek inscriptions.
For this work I am not tied to Gephi, but I do like its interface and low learning curve, which is valuable for pedagogical and collaborative use. So, my first order of business is getting a Gephi project to talk nicely with D3.js. There is, of course, a nice example already in the wild: http://bl.ocks.org/susielu/9526340. However, this presented some serious problems, which I will outline to (hopefully!) help others who may be going down this path. So, refer back to http://bl.ocks.org/susielu/9526340 for the code template – what follows below are additions / modifications.
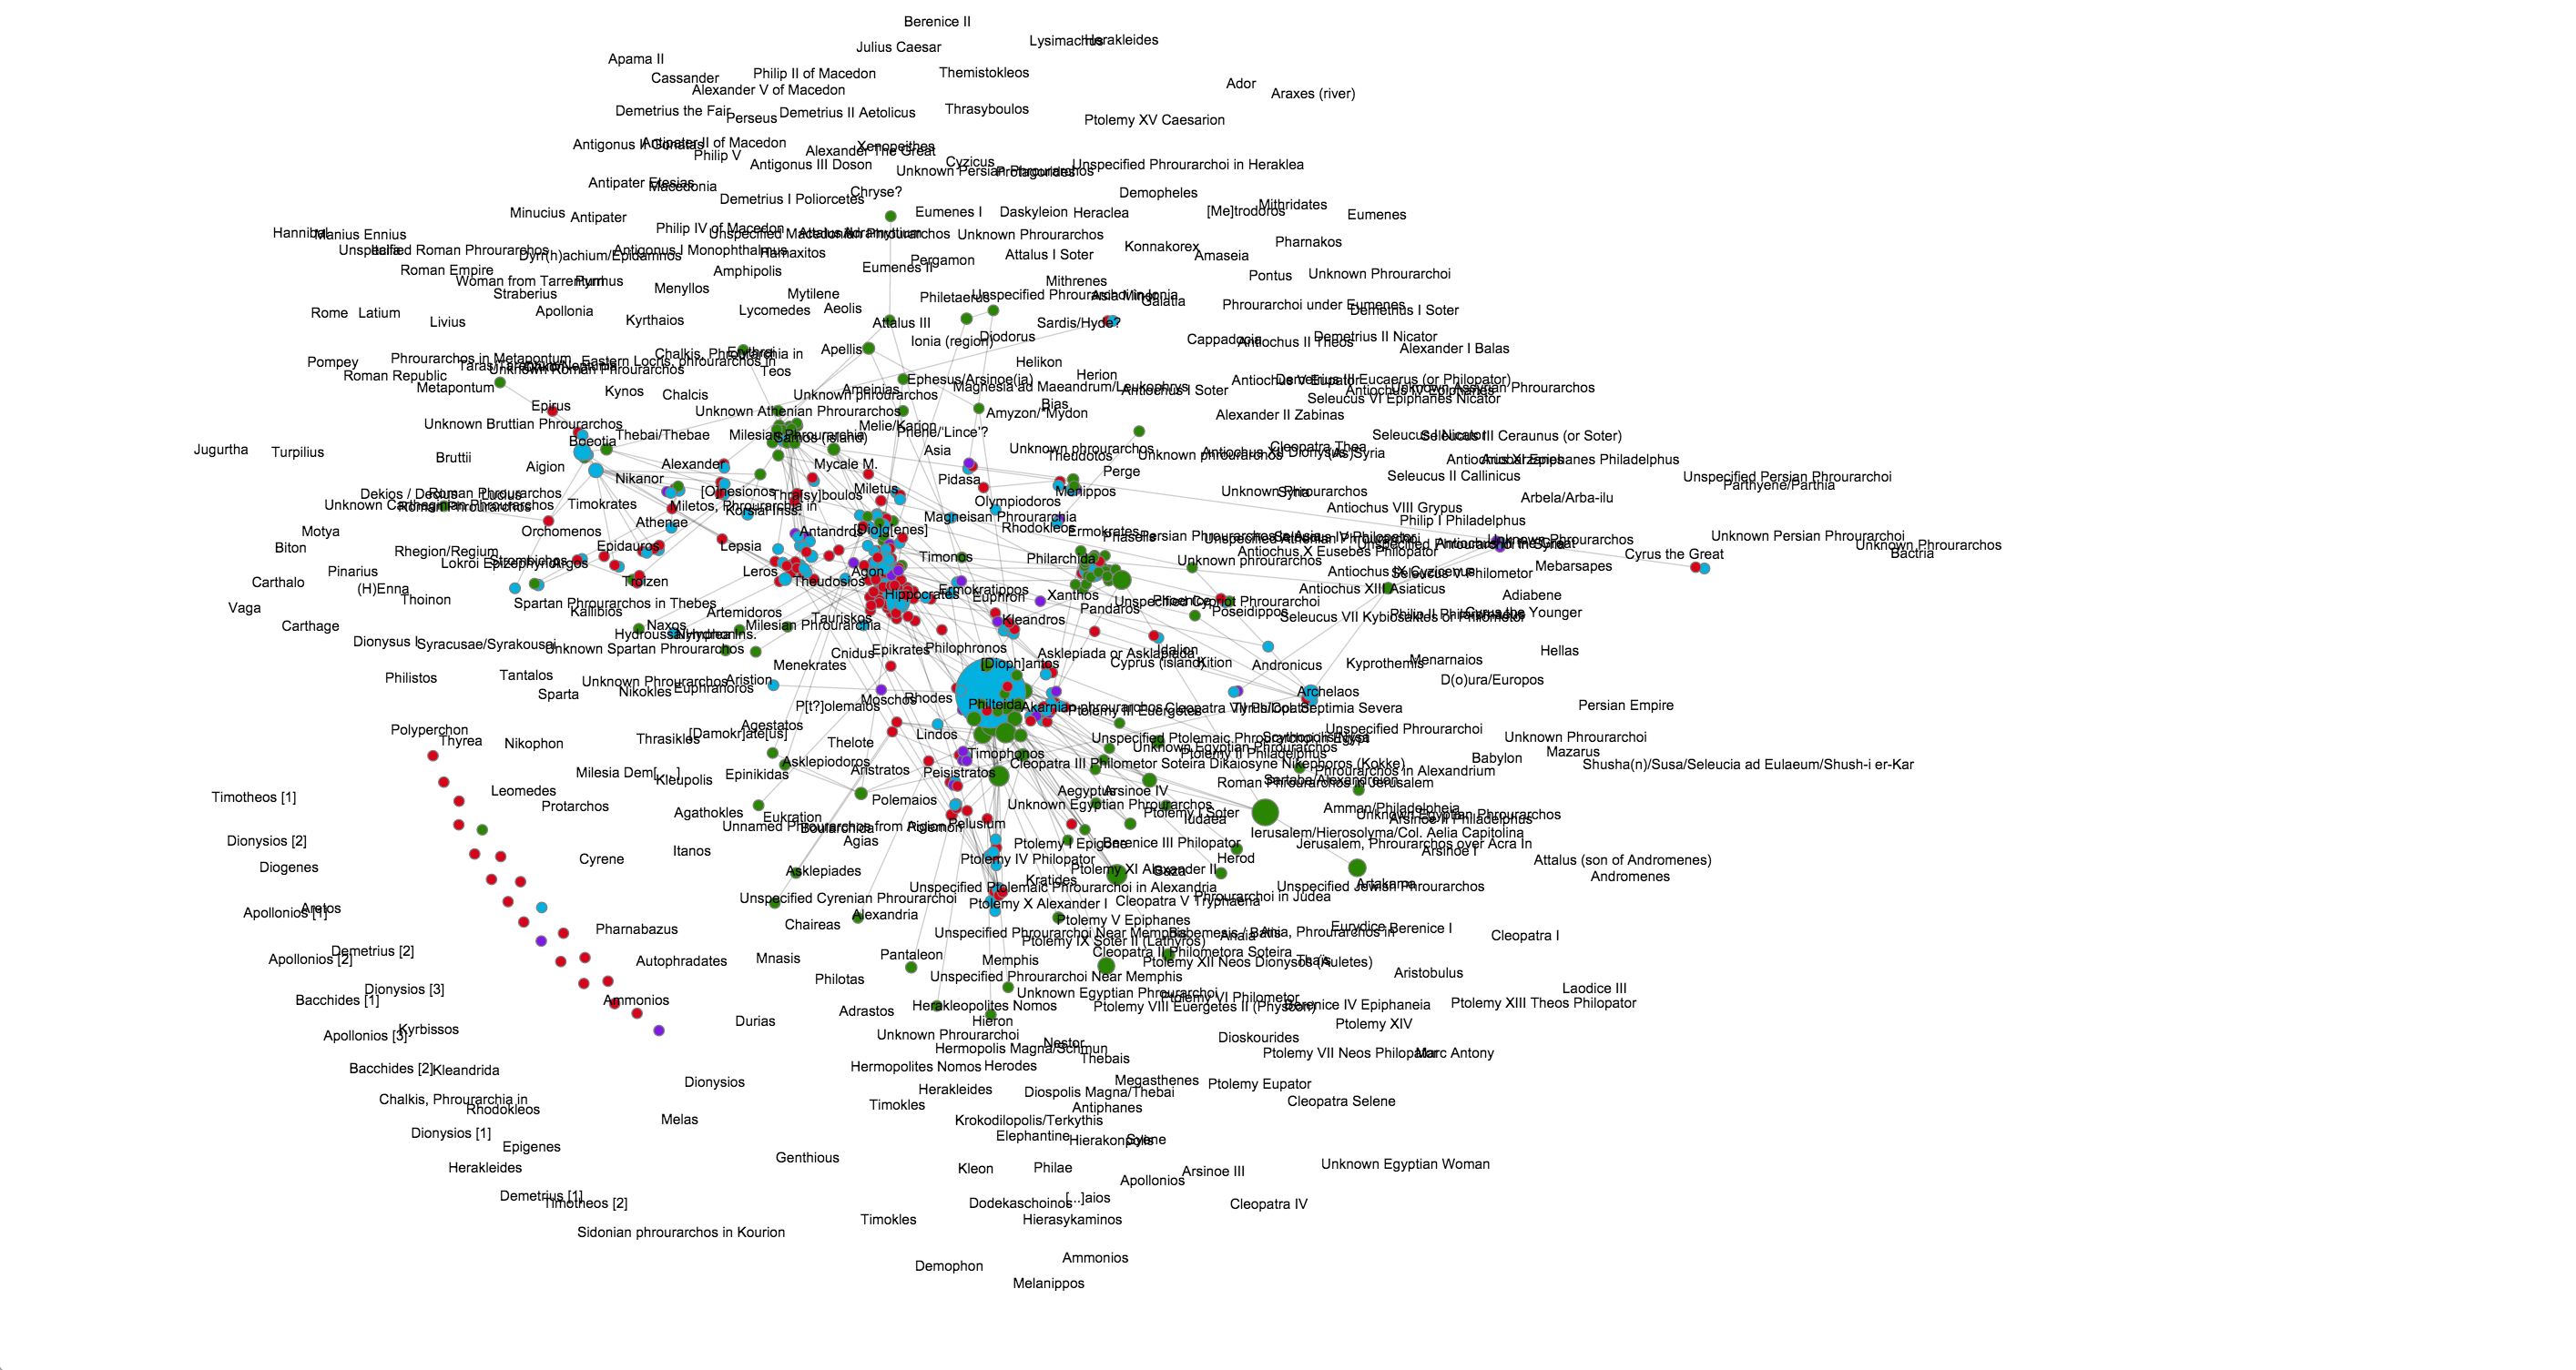
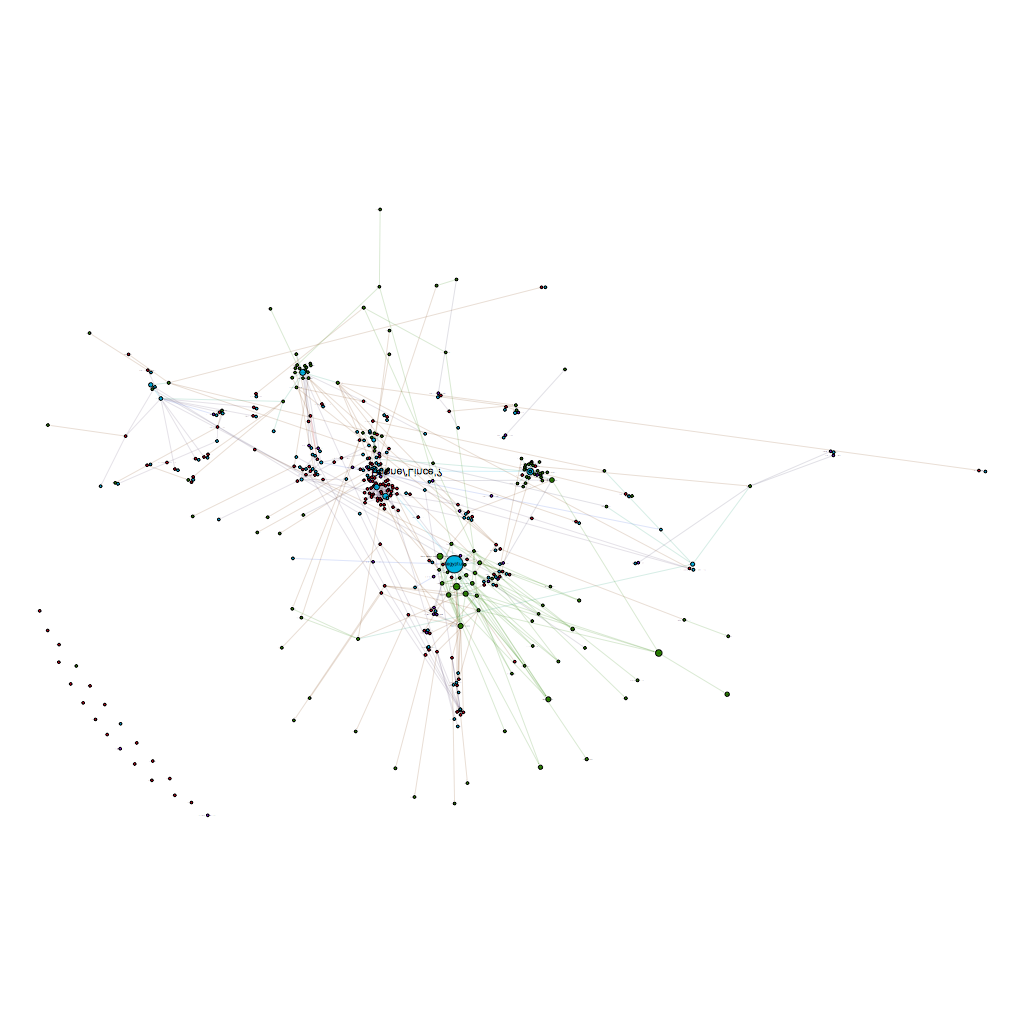 For this project, I want to recreate the image to the right, which was created in Gephi. If you read my previous post on this topic, this image uses a geo-layout plugin to place locations from Pleiades in their correct geographic placement, then uses other layouts to place the people and other non locatable nodes. The eventual goal is to make an interactive network map above an interactive geographic map, so simply exporting these out as a flat svg file will not provide the functionality I need.
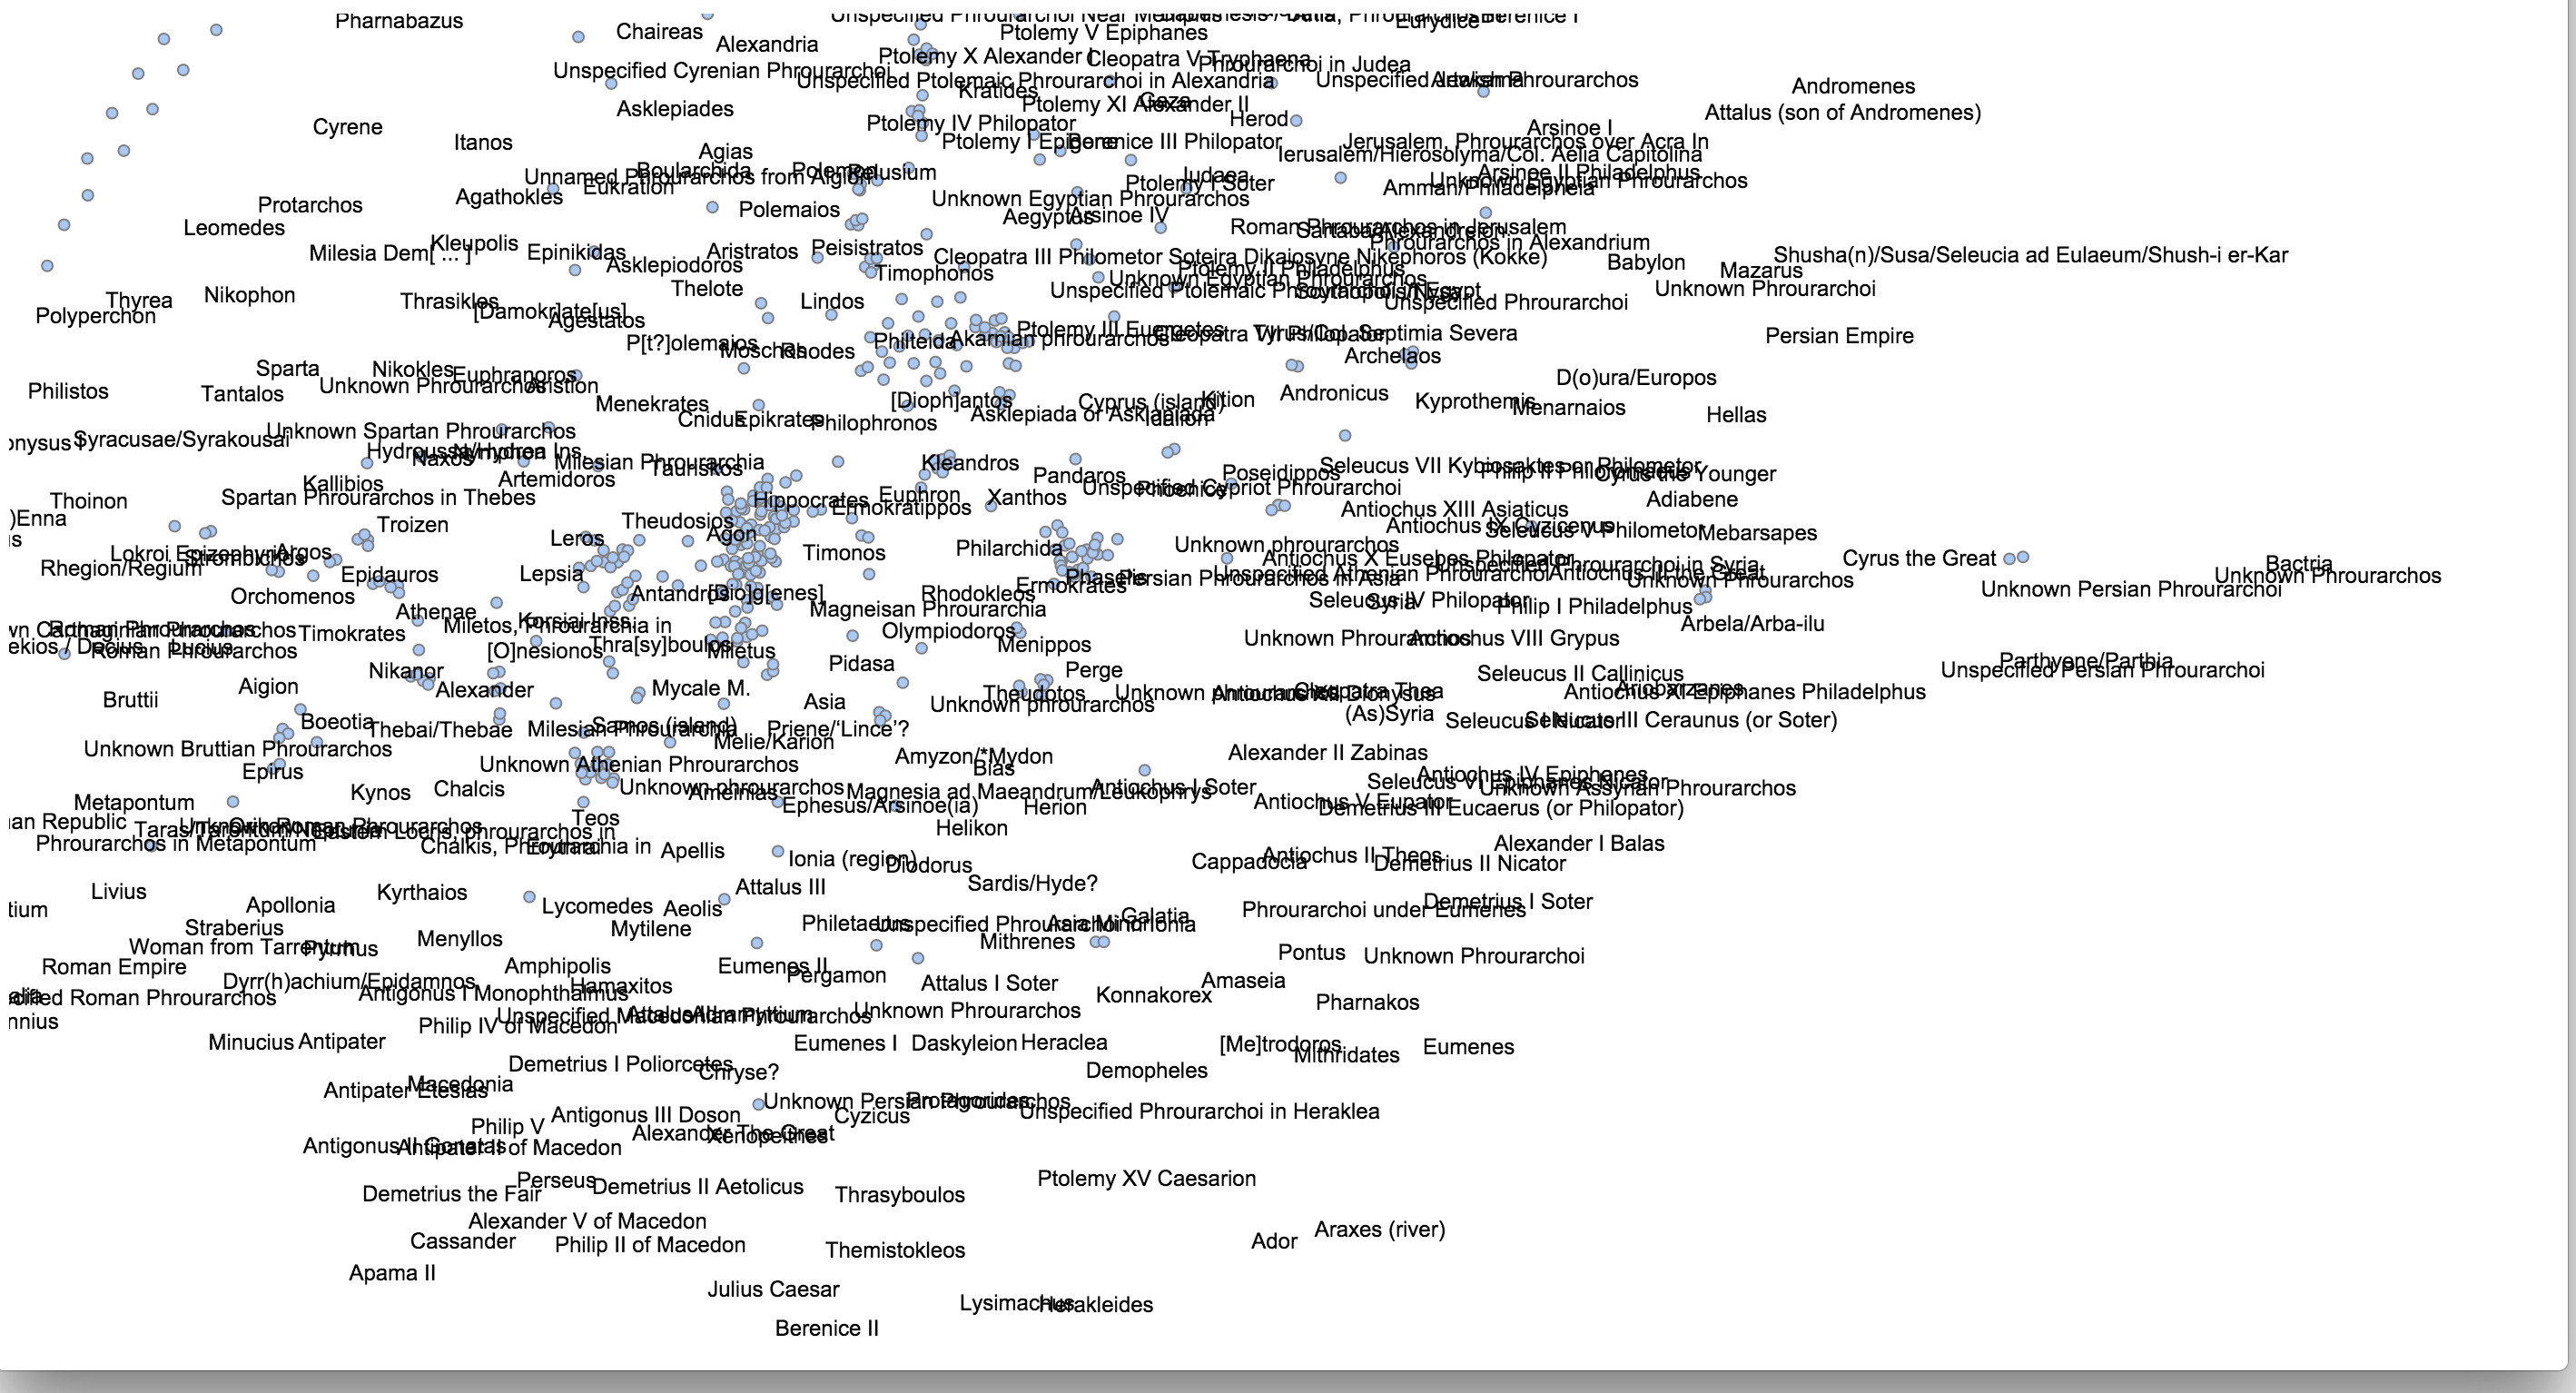
My first attempt to simply plug in my own data met with disaster. First, I got hit with an “Uncaught TypeError: Cannot read property ‘weight’ of undefined” error and absolutely no graph. Looking into it, I noticed that the example assumed that nodes would be referenced by their position in an index, NOT by their own id.
 var links = json.edges.map(function(d){
 return {
 'source': parseInt(d.source),
 'target': parseInt(d.target)
 }
 })
My linkages use a unique ID text attribute, which plays havoc with this function. However, this seems like a simple fix: simply remove the parseInt() function, and the actual linkages should work.
var links = json.edges.map(function(d){
 return {
 'source': d.source,
 'target': d.target
 }
 })
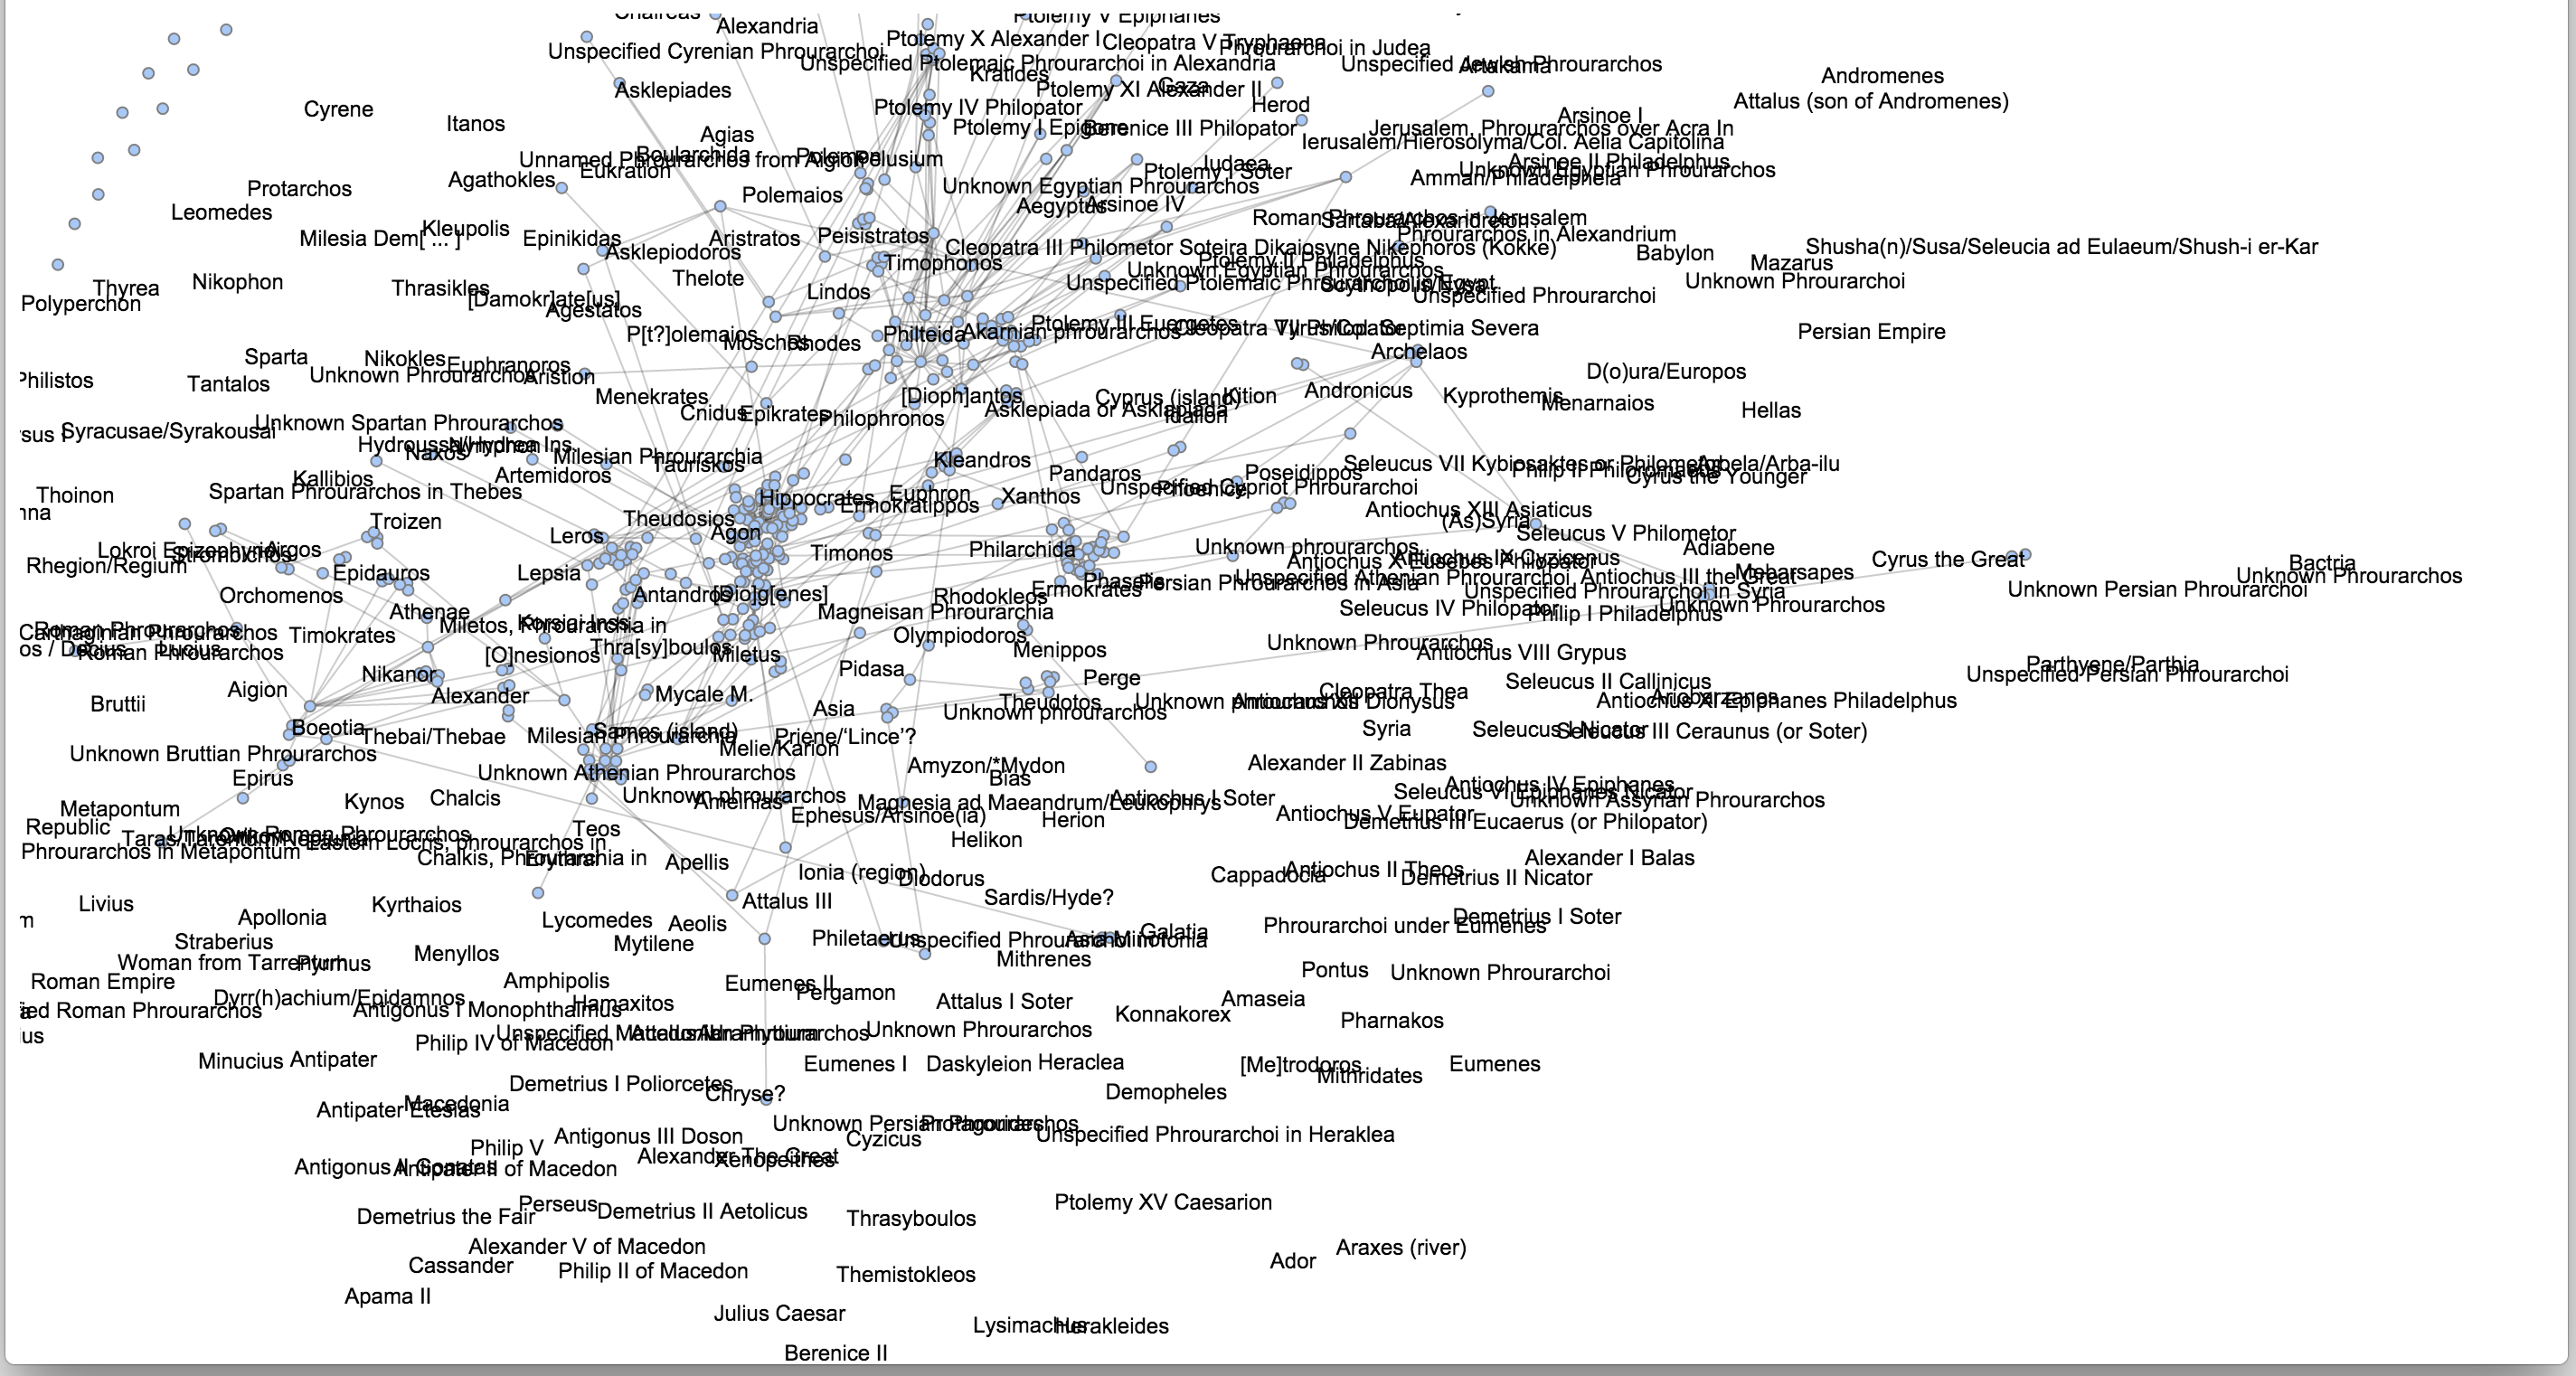
 Getting closer: I see a network graph….only minus the network. Yikes. So, what is going wrong?
It seems that linking nodes by attribute instead of index is a somewhat common problem in D3.js, with a good solution here: http://stackoverflow.com/questions/23986466/d3-force-layout-linking-nodes-by-name-instead-of-index. Following this example, I modified my code by adding the following:
var edges = [];
links.forEach(function(e) {
// Get the source and target nodes
var sourceNode = nodes.filter(function(n) { return n.id === e.source; })[0],
targetNode = nodes.filter(function(n) { return n.id === e.target; })[0];

// Add the edge to the array
edges.push({source: sourceNode, target: targetNode});
});

...

var force = d3.layout.force()
.nodes(nodes)
.links(edges)

...

var link = svg.selectAll(".link")
.data(edges)
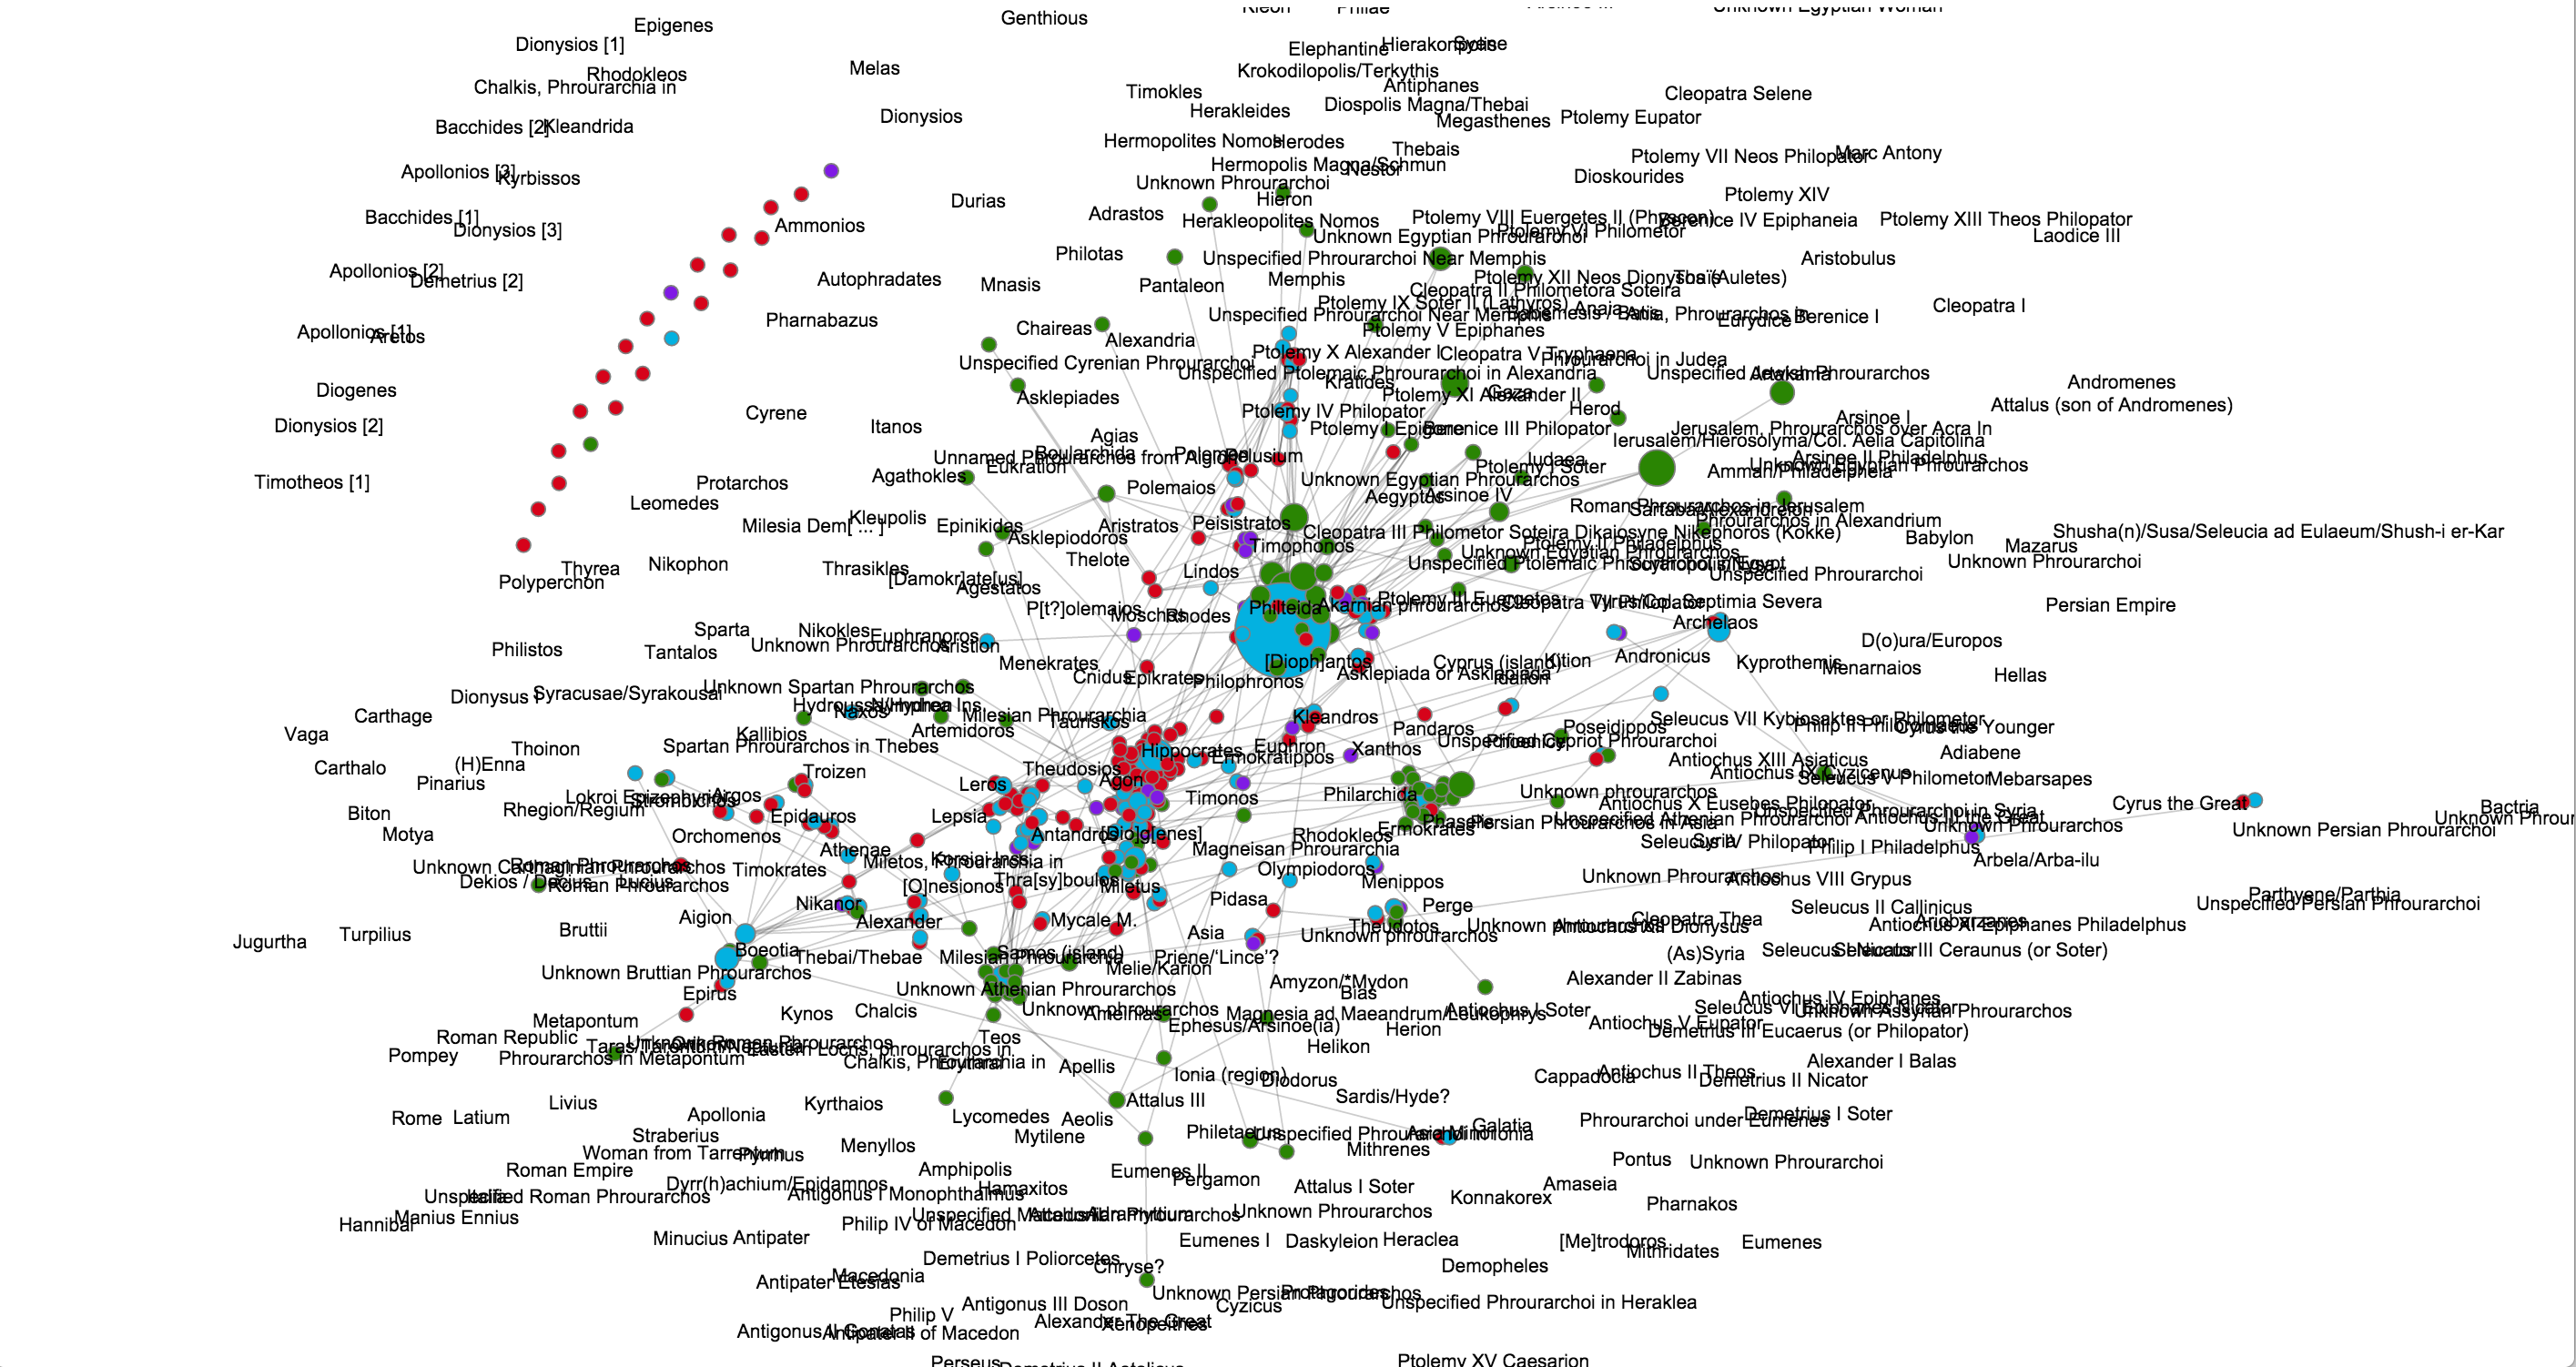
 Finally, the links show! The nodes, however, are of a uniform size. I want the nodes to reflect their size in Gephi. Luckily this was an easy fix: adding
.attr("r", function(d) { return d.size * 3; })
to
node.append("svg:circle")
did the trick. I also wanted to add colors from Gephi – the following code does so (with a conversion from RGB to hex provided by http://stackoverflow.com/questions/13070054/convert-rgb-strings-to-hex-in-javascript) :
var a = d.color.split("(")[1].split(")")[0];
a = a.split(",");

var b = a.map(function(x){ //For each array element
 x = parseInt(x).toString(16); //Convert to a base16 string
 return (x.length==1) ? "0"+x : x; //Add zero if we get only one character
})

b = "#"+b.join("");


 return {
 'id' : d.id,
 'x' : d.x,
 'y' : d.y,
 'fixed': true,
 'label' : d.label,
 'size' : d.size,
 'color' : b,
 }

 })
and
.style("fill", function (d) { return d.color; })
added to
node.append("svg:circle")
 This produces a graph that looks correct except for one MAJOR problem: It seems the Y axis is inverted from the original! This is obviously not acceptable if I am trying to capture actual coordinates for a map. All is not lost: I do remember this being a problem in the SigmaJS exporter. A fix is provided here: https://github.com/oxfordinternetinstitute/gephi-plugins/issues/5#issuecomment-22291683. For me, this was as simple as adding the following code:
finalY = -d.y;
return {
'id' : d.id,
'x' : d.x,
'y' : finalY,
'fixed': true,
'label' : d.label,
'size' : d.size,
'color' : b,
}

})
to the
var nodes = json.nodes.map(function(d)
block.
 The next task will be to finalize some functionality for the D3.js portion of the graph, then on to integrating the whole mess with leaflet. Then, when I have all of this in order, time to re-write it to accept all manner of different inputs / etc for BAM. More on both of these ideas later.

1 thought on “1 of N: Gephi, D3.js, and maps”